Markets got quite a surprise from the Trump administration last week in the form of tariffs above even the most aggressive forecasts, increasing the risks to economic growth and corporate profits. China quickly retaliated, Europe may follow with tariffs of their own, and some countries may boycott American goods. Some of these tariffs will be passed along to already inflation-weary consumers in the form of higher prices, which will drag down consumer spending while also putting anticipated Federal Reserve (Fed) rate cuts into question. However, there are some possible silver linings once the dust settles. We’re past peak uncertainty and maybe peak pessimism as well. Tariff rates should go down from here as negotiations begin. Interest rates should head lower as the deficit narrows, bringing borrowing costs down. Oil prices are down sharply. And tax cut extensions will be larger and easier to pass. Long-term investors may want to consider doing a little rebalancing into stocks this week after recent bond market gains. More active traders may want to wait for better headlines before stepping in.
After much anticipation, the tariff band-aid was finally ripped off on Wednesday, April 2. Unfortunately for the stock market, the news was painful as the White House rolled out 10% universal tariffs on all imports coming into the country, with additional duties levied on countries operating with large trade deficits with the U.S. The size and scope of the tariffs caught the market off guard, causing a sharp sell-off in global equity markets as market participants assessed the potential impact of the new trade policies on economic growth, inflation, interest rates, and corporate profits. Here we share some of our key takeaways from the news (there’s a lot to unpack) and discuss some silver linings that didn’t get much attention last week and may set the stage for a durable stock market low.
Alarming Tariff Rates
As the trade policies currently stand, and assuming no negotiations on reciprocal tariffs, the weighted average U.S. tariff rate could jump from 2.3% in 2024 to 20% or higher depending on how sectoral tariffs shake out. For historical context, the Smoot-Hawley Tariff Act of 1930, one of the causes of the Great Depression, took the U.S. average tariff rate to 20%. The 20% estimate, including what had already been in place before April 2, what went into effect on April 5, and what comes on April 9, could be higher depending on what happens with yet-to-be announced sectoral tariffs (pharmaceuticals and semiconductors) and commodities (copper, lumber). Market expectations were for an all-in rate in the 10–15% range, so this was clearly a negative surprise.
Trump Tariff Proposals Lift Rates to Highest Level Since Great Depression
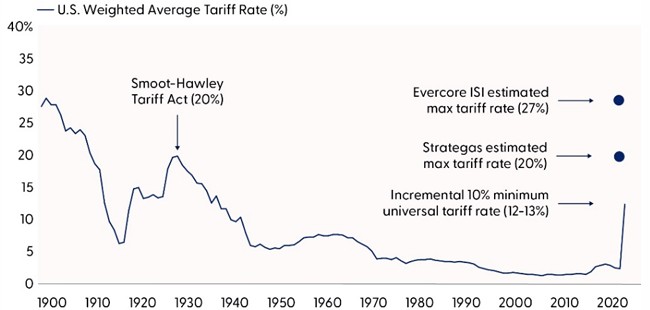
Source: LPL Research, Bloomberg, Strategas Research, Evercore ISI Research, International U.S. Trade Commission, 04/06/25
Disclosures: Forecasts may not materialize as predicted and are subject to change.
Market expectations going into the event were for the effective tariff rate to climb closer to 10–15%. There is room for negotiation on reciprocal tariffs, which has already started. In addition, legal challenges may bring some of these rates down (unlikely, but it wouldn’t shock us). But based on comments from Trump and Treasury Secretary Scott Bessent, as well as other administration officials, these rates are likely to stay high (they could even go higher if countries retaliate more, as Canada and China have already announced). We have already observed how tough it is to reduce non-tariff barriers to negotiate lower rates in the cases of Vietnam and Israel. Bessent’s warning to U.S. trading partners: “Sit back, take it in, let’s see how it goes. Because if you retaliate, there will be escalation. If you don’t retaliate, this is the high watermark.”
Asia Bears the Brunt
In terms of countries, China was hardest hit it with a 54% rate (a fresh 34% on top of the 20% already in place). That excludes the potential additional 25% tariff for buying Venezuelan oil, which could take the rate to a whopping 74%. Vietnam’s 46%, Taiwan’s 32%, Indonesia’s 32%. India’s 26%, and Japan’s 24% are also on the high side, although Europe had some high rates as well, including Switzerland at 31%, while the rate for the European Union came in at 20%. Canada and Mexico were winners as they face only autos, steel, and aluminum tariffs at this point and those may come down to the minimum 10% rate after the USMCA is renegotiated.
Asian Countries are Tariff Losers; Latin America Relatively Unscathed
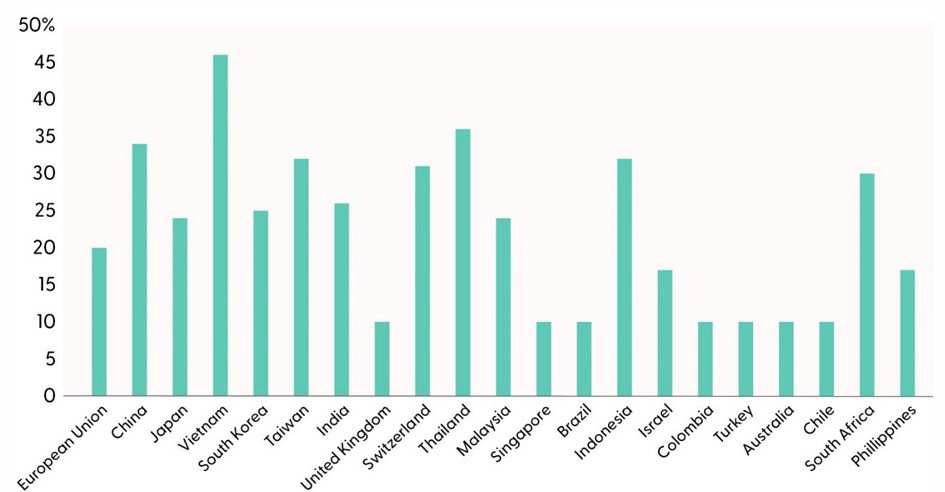
Source: LPL Research, Bloomberg, whitehouse.gov, 04/04/25
Potential Impact on Economic Growth
Our U.S. economy is quite resilient. We rallied after 9/11. Banking regained confidence after the Great Financial Crisis. Supply chains recovered amid a pandemic shutdown.
The 2025 seismic shift in trade policy will also become a defining moment in our economy, yet much remains unknown. Jerome (Jay) Powell, Chair of the Federal Open Market Committee (FOMC), recently cautioned investors that the size and duration of tariff-induced shocks remain unclear. Our view at LPL Research is that the ultimate effects will include higher inflation and slower growth. Perhaps tariffs will become the catalyst that pushes the U.S. economy into recession.
Supply-Induced Inflation Pressure
The supply constraints immediately following the global pandemic serve as a good analogy to the potential effects from large tariffs. We know supply chain disruptions were a major factor in the inflation spike and its persistence. Over 60% of the surge that began in 2021 and lasted into much of 2022 was from supply chain pressures. As businesses adjust to the new trade policies of President Trump, we expect shifts in supply chains to create similar inflation risks despite different causes. Amid the angst, investors should remind themselves that the economy plodded through despite immense hurdles. During the worst period of clogged supply chains, over 100 container ships were waiting to arrive at Southern California ports. One could argue that having zero imports is worse than receiving tariffed imports.
Tepid Growth in Q1
We expect first quarter growth to approach zero. And that was before Liberation Day. Lower real consumer spending so far in January and February increased the risk of no or even negative economic growth in Q1. However, we do think some consumers and businesses pulled forward their demand into March in anticipation of upcoming tariffs.
Going forward, investors need to track how U.S. trade policy morphs with Mexico and Canada. The U.S. imports roughly 28% of all goods from just these two countries, so the potential impacts from the tariffs will depend on the ultimately renegotiated USMCA trade agreement, as well as the flexibility and availability of alternative supplies for U.S. businesses and the extent of approved exceptions.
USMCA Trade Deals Will Be Key to Softening the Blow
Percent of Total U.S. Imports by Country
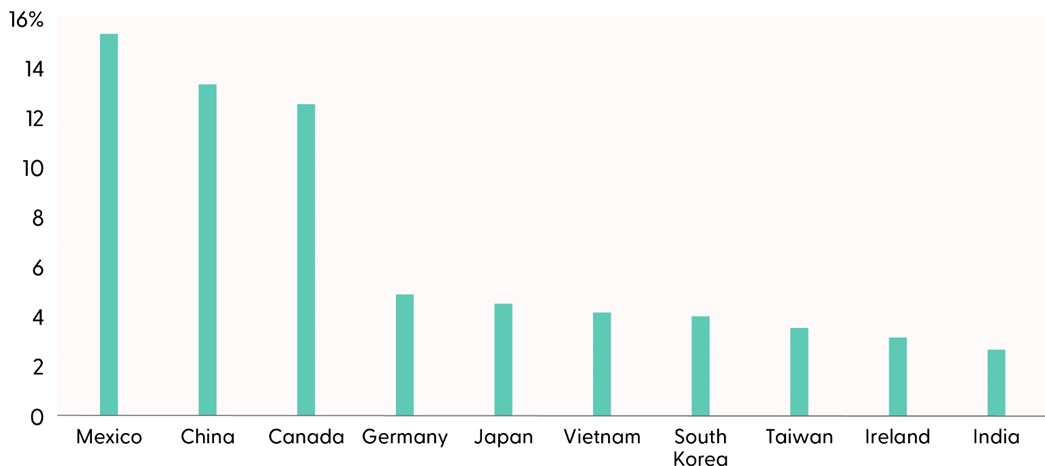
Source: LPL Research, Census Bureau, 04/04/25
Stock Market Response
In the context of a large potential hit to economic growth and earnings from the new tariffs, a stock market correction is not hard to understand (although we admit the magnitude of last week’s sell-off is surprising). Higher costs for companies importing foreign goods in a slow-growth, possibly recessionary, moderate revenue environment is a formula for lower earnings and, even if temporary, higher prices. Not a great combination for stocks. Add in China buying fewer iPhones, Teslas, Nikes, and the like from us and you get more earnings drag on U.S. multinational companies.
Goldman Sachs estimates that every five points of additional tariffs the U.S. places on its trade partners is an estimated 1.5% hit to S&P 500 profits (which seems reasonable to us). That means a 20% tariff rate (up from 2–3%) could cause corporate profits to drop 5% or more. Some of that reduced earnings outlook was already priced in before Wednesday’s announcement as the economy has slowed, but the negative surprise, along with China’s retaliation (if it sticks) will take profit expectations down even further.
Following these tariff announcements, LPL Research’s below-consensus $260 forecast for S&P 500 EPS in 2025 is at risk and under review. Clearly, consensus estimates around $268 will come down materially in coming weeks, or once it’s clear where final tariff rates might land after negotiations take place. It’s impossible to know where the tit for-tat ends and therefore, predicting the earnings impact is incredibly difficult. But suffice it to say the $250–255 range is in play and our year-end fair value target range, also under review, will likely have to come down from its current 6,275–6,375.
Technical Perspective
From a technical perspective, damage continues to mount as investors reprice downside risk to growth across risk assets. The S&P 500 is retesting the August 2024 lows (5,119–5,186 range). A break below this area would leave the 5,000-point milestone, the April 2024 lows at 4,954, and the 2022 highs near 4,800 as the next major areas of downside support.
Within the index, 75% of constituents registered new four-week lows on Friday, while around 40% were also oversold based on a 30 or less Relative Strength Index (RSI). Furthermore, the percentage of stocks above their 20-day moving average dropped to only 9% — a reading in this indicator of 10% or less has historically overlapped with correction low capitulations.
Outside of the technical damage, panic was evident in surging put/call ratios and the CBOE Volatility Index (VIX) intraday high spike to 45.56. We have found that top decile readings based on VIX intraday highs have historically been the most significant signal for identifying downside capitulation points. Since 1992, when the intraday VIX high reached 30.1 or more, one-, six-, and 12-month S&P 500 returns averaged 1.5%, 7.4%, and 15.6%, respectively. The historic degree of washed-out conditions suggests selling pressure could be approaching a point of exhaustion, but we recommend waiting for support to be found until considering this a tradeable low.
Silver Linings
The good news is markets have probably moved past maximum uncertainty and are working their way through max pessimism. Though that can’t be measured precisely, the significant two-day downdraft adds to the evidence that bearish sentiment has reached an extreme. The AAII bull-bear survey has bears as plentiful as they ever get, setting up a potential contrarian reversal. This pessimism is a key element of the stock market’s bottoming process.
So, is it time to buy the dip? If stocks haven’t bottomed, we think they are close. We got a flush, or washout, based on technical indicators. Tariff rates may start to come down soon (though this is admittedly hard to predict). The deficit reduction that can come from tariff revenue can help lower interest rates, potentially supporting stock valuations. Tax cut extensions will be larger and easier to pass, funded by tariff revenue. A Fed put (an option to sell at a particular price) may be close, if not a Trump put, a level at which the president may step in to try to support stocks before this downdraft goes much further. Oil prices are down sharply. Buying when stocks are down 15–20% is frequently a winning trade, though the win certainly has come faster historically if recession is avoided. That can’t be ruled out.
Buying when policy uncertainty is high also tends to be a winning trade. As we wrote in “Tariff Uncertainty Facing Stocks to Start Clearing Soon” last week, the S&P 500 gained 7% three months after the peak in trade policy uncertainty on August 31, 2019, and more than 16% until the pre-pandemic high on February 19, 2020.
So, despite material risk to economic growth, inflation, and earnings, we think it’s about time to consider adding risk, where appropriate. Don’t pull the trigger yet; wait for the bad news to get less bad. A winning tariff negotiation or two by some of our Asian trading partners could spark a turnaround.
Bond Market Starts to Show Some Cracks
While equity markets have borne the brunt of tariff and subsequent trade war concerns, fixed income markets are dealing with the competing narrative of slowing growth and higher inflation. High inflation, of course, erodes the value of the fixed nature of bond coupon payments, whereas slowing growth tends to increase the value of high quality fixed income as it’s traditionally benefited from the flight-to-safety haven trade. However, since the beginning of the new Trump administration, short-term inflation expectations have increased, while at the same time growth expectations have been falling (growth expectations can be derived from the fall in “real yields”, which are Treasury securities that are adjusted for inflation expectations). Traditionally, when real yields decline while inflation expectations rise, fixed income markets are suggesting that economic growth is expected to weaken while consumer and business prices are expected to increase — the defining characteristics of stagflation, which is not a good environment for fixed income markets.
Over the last few trading sessions last week, fixed income investors have become more concerned about the growth side of the narrative, which has pushed Treasury yields meaningfully lower (prices higher) with the yield on the 10 year falling to around 3.9% (from 4.36% on March 27). The fall in Treasury yields has helped diversified investors weather some of the tariff fallout in the equity markets — a reminder that high-quality fixed income markets, particularly Treasuries and agency mortgage-backed securities, not only provide income but act like a ballast to portfolios during elevated market uncertainty. So, what comes next? While it’s too early to fully understand the economic ramifications of a potential trade war, the tug-of-war between slowing growth and higher inflation will likely continue to add volatility to markets. If conditions do deteriorate and the economy slows meaningfully or even contracts, investors will likely continue to benefit from an allocation to high-quality fixed income investments. Interest rates may fall as deficits potentially narrow thanks to the additional tariff revenue.
Stagflation Lite?
Growth Expectations Are Falling While Inflation Expectations Are Rising
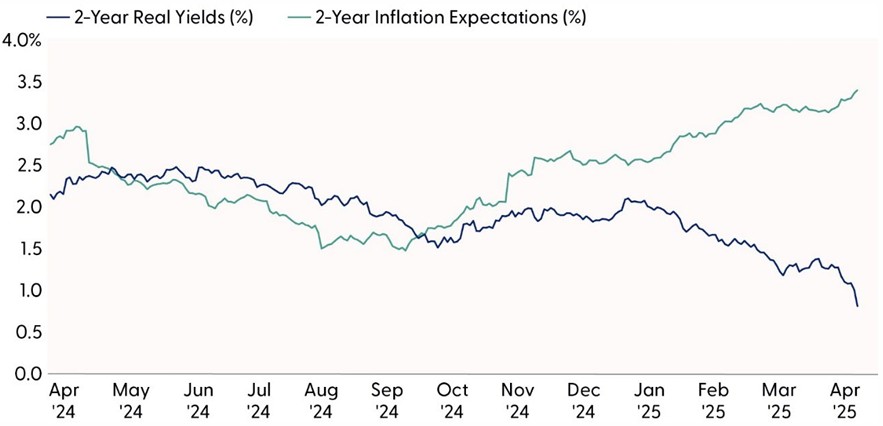
Source: LPL Research, Bloomberg, FactSet 04/04/25
Disclosures: Past performance is no guarantee of future results.
Real yields are inflation adjusted yields. Inflation expectations are based on the difference between nominal Treasuries and Treasury Inflation-Protected Securities (TIPS).
Growth Concerns Weigh on the Greenback
Following the administration’s unexpectedly severe tariff announcements on Wednesday, global markets moved largely as would be expected to the negative news. One notable exception was the sharp decline in the U.S. dollar, which experienced significant weakness against most other currencies with relatively few exceptions. This downturn in the dollar appears to stem from a broader shift in sentiment regarding the implications of the newly imposed tariffs.
Before the announcement, tariffs were largely seen as beneficial for the dollar, based on the expectation that other countries would move to weaken their currencies in response to any trade measures. However, the sheer magnitude of the increases has heightened market concerns about potential disruptions to U.S. economic growth, as well as inflationary pressures that may arise from these policies. Additionally, market participants are increasingly wary of the possibility that international investors may begin reassessing their overall asset allocations, potentially leading to a reduced emphasis on U.S.-based investments and investment capital beginning to flow away from the U.S. more materially. This shift in perspective has contributed to the downward pressure on the dollar, reflecting the growing unease surrounding the broader economic impact of these tariff measures.
As investors continue to evaluate the longer-term consequences, foreign exchange markets are likely to experience further volatility in response to evolving policy developments.
Conclusion
Markets got hit with a big negative surprise with high tariff rates on all key U.S. trading partners, dragging stocks into a severe correction. Risks of stagflation and recession have risen and the hit to U.S. corporate profits will be meaningful. While max uncertainty has passed and we have moved on to max pessimism, lowered tariff rates are the next step. Once negotiations start to bear some fruit and some tariffs come down, we believe the chances are good that the stock market low will be in. There are some silver linings for markets in what is going on (lower yields, lower oil) and what is yet to come (tax cuts). It just may take markets more time — hopefully weeks, not months — to fully turn their focus in that direction. In the meantime, the odds of recession and an S&P 500 bear market are rising.
Asset Allocation Insights
LPL’s Strategic and Tactical Asset Allocation Committee (STAAC) maintains its tactical neutral stance on equities, with a preference for the U.S., growth over value, and large caps over small. Despite the stock market correction, the Committee does not rule out the possibility of additional short-term weakness due to the severity of the Trump tariffs and increased risk of recession. At the same time, with stocks down double-digits, the risk-reward trade-off has improved, and negotiations will likely bring tariff rates down. LPL Research continues to monitor tariff news, economic data, earnings estimates, and various technical indicators to identify a potentially attractive entry point to add equities and anticipates making a move fairly soon.
Within fixed income, the STAAC holds a neutral weight in core bonds, with a slight preference for mortgage-backed securities (MBS) over investment-grade corporates. In our view, the risk-reward for core bond sectors (U.S. Treasury, agency mortgage-backed securities, investment-grade corporates) is more attractive than plus sectors. We believe adding duration isn’t attractive at current levels, and the STAAC remains neutral relative to our benchmarks.
Important Disclosures
This material is for general information only and is not intended to provide specific advice or recommendations for any individual. There is no assurance that the views or strategies discussed are suitable for all investors or will yield positive outcomes. Investing involves risks including possible loss of principal. Any economic forecasts set forth may not develop as predicted and are subject to change.
References to markets, asset classes, and sectors are generally regarding the corresponding market index. Indexes are unmanaged statistical composites and cannot be invested into directly. Index performance is not indicative of the performance of any investment and do not reflect fees, expenses, or sales charges. All performance referenced is historical and is no guarantee of future results.
Any company names noted herein are for educational purposes only and not an indication of trading intent or a solicitation of their products or services. LPL Financial doesn’t provide research on individual equities.
All information is believed to be from reliable sources; however, LPL Financial makes no representation as to its completeness or accuracy.
All investing involves risk, including possible loss of principal.
US Treasuries may be considered “safe haven” investments but do carry some degree of risk including interest rate, credit, and market risk. Bonds are subject to market and interest rate risk if sold prior to maturity. Bond values will decline as interest rates rise and bonds are subject to availability and change in price.
The Standard & Poor’s 500 Index (S&P500) is a capitalization-weighted index of 500 stocks designed to measure performance of the broad domestic economy through changes in the aggregate market value of 500 stocks representing all major industries.
The PE ratio (price-to-earnings ratio) is a measure of the price paid for a share relative to the annual net income or profit earned by the firm per share. It is a financial ratio used for valuation: a higher PE ratio means that investors are paying more for each unit of net income, so the stock is more expensive compared to one with lower PE ratio.
Earnings per share (EPS) is the portion of a company’s profit allocated to each outstanding share of common stock. EPS serves as an indicator of a company’s profitability. Earnings per share is generally considered to be the single most important variable in determining a share’s price. It is also a major component used to calculate the price-to-earnings valuation ratio.
All index data from FactSet or Bloomberg.
This research material has been prepared by LPL Financial LLC.
Not Insured by FDIC/NCUA or Any Other Government Agency | Not Bank/Credit Union Guaranteed | Not Bank/Credit Union Deposits or Obligations | May Lose Value
For public use.
Member FINRA/SIPC.
RES-0003761-0325 Tracking #720090 | #720092 (Exp. 04/26)