After one of the best starts to a bull market in history, the rally has started to show signs of fatigue. A strong economic recovery lies ahead as the roepening continues, bolstering a very strong earnings outlook that is helping stocks grow into elevated valuations. However, in the second half of the year, as inflationary pressures build, interest rates potentially rise further, and this bull market gets a little older, the pace of stock market gains will likely slow and come with more volatility.
History Doesn’t Repeat But It Often Rhymes
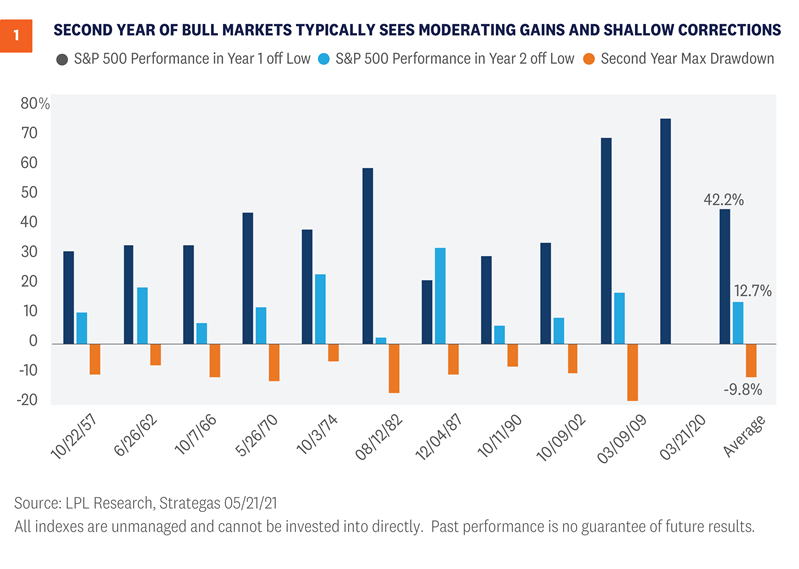
After a nearly 90% rally off the March 2020 lows, it’s not much of a surprise that since mid-April the S&P 500 Index has been choppy and generally moved sideways. Consider that the 1982 and 2009 bull markets both suffered from some fatigue several months into their second years, providing a useful historical analogue. With the U.S. economy picking up speed as the end of the pandemic likely approaches, the economic cycle is maturing. The pickup in inflation and related concerns about the Federal Reserve (Fed) pulling back support offer evidence of an economic cycle getting a bit older. Older cycles tend to bring more moderate stock market gains.
Although no one would argue that this cycle looks like any other we have experienced in modern history, studying the second year of historical bull markets—as we also did in our Outlook 2021—can be instructive. Looking back at all of the bull markets since 1950, the average S&P 500 gain during the second year has been about 13% [Figure 1]. With stocks already up about 7% since March 23, 2021, following this pattern would allow for about 6% upside over the next 10 months. However, when focusing on bull markets that followed 30% or greater declines, as the current one did, the average gain during the second year has actually been 17%. Achieving that return would put the index above the high end of our year-end S&P 500 target range of 4,400 to 4,450.
We can also look at pullbacks (5-10% decline) and corrections (10-20% decline) during the second years of historical bull markets for a guide to the type of volatility the stock market might experience over the next six to nine months. As shown in [Figure 1], the average maximum drawdown for the index during those years has been about 10%. In the second year of the 2009 bull market, the index corrected about 17%. Given the fast pace of the reopening and the amount of stimulus spending still working its way through the economy, we would expect drawdowns to be average, if not less, as the bull market moves closer to its third birthday on March 23, 2022.
Inflation that proves more intense and longer lasting than the Fed expects, which could drive interest rates sharply higher, ranks at the top of potential causes of a correction in the second half of 2021 or early in 2022.
Earnings Outlook Strengthens
Coming off of a stunning first-quarter earnings season that saw results well ahead of the best-case scenario for nearly all strategists, corporate America is firing on all cylinders. As shown in [Figure 2], not only are earnings expected to ramp up significantly over the remainder of 2021 as the economic rebound continues, but estimates have risen significantly since the start of the year.

Reflecting the tremendous strength in corporate profits, our forecast for S&P 500 earnings per share (EPS) in 2021 is $187.50-$190, a 34% increase from 2020, and up from our prior $165 estimate at the start of the year. We believe our estimated range, which is in line with the current consensus estimate, is reasonable given the strong economic growth outlook and massive amount of fiscal stimulus still working its way through the economy. Given the trajectory of economic growth and tremendous momentum exhibited by corporate America during the first quarter, it’s not hard to envision even higher numbers.
A significant pickup in inflation could present risk to corporate profit margins. If the labor market tightens in a fully reopened economy, companies may see upward pressure on wages. Supply shortages, higher commodity prices, and rising borrowing costs may also erode profitability of U.S. companies. U.S. businesses are also closely monitoring policy developments, as a potential increase in the corporate tax rate would have an immediate impact on their bottom lines. Meanwhile, some international economies are still struggling to get through the pandemic, which could present a headwind for U.S.-based multinationals.
Low Interest Rates Supporting Valuations
Strong earnings growth is helping stocks grow into elevated valuations. However, based on the most commonly used valuation metrics such as the price-to-earnings ratio (P/E), stock market valuations are still elevated. The S&P 500 Index is trading at a forward P/E of 21 times the consensus earnings estimate for the next 12 months, several points above the post-1980 average of 17 (source: FactSet). By that measure, a lot of good news is priced in.
But we would not evaluate stock valuations in a vacuum. Fundamentally, stock valuations represent the present value of future earnings. When we calculate today’s value of future profits, interest rates come into play. When incorporating interest rates into valuation analysis, we find stocks are actually quite reasonably priced. Based on 2021 forecasts relative to their prices, S&P 500 earnings are about three percentage points cheaper than the 10-year Treasury “earnings,” which is their yield. The long-term average of this “equity risk premium” is about 0.8%, indicating stocks are cheaper than bonds, as we discussed in our April 26, 2021 Weekly Market Commentary.
If inflation risk remains manageable throughout the second half of the year and yields rise only gradually, we would anticipate that earnings growth would continue to support market gains.
Conclusion
We expect additional gains for stocks in the second half of the year, but they are likely to be more modest than the gains we’ve seen so far, and those additional gains are likely to come with more volatility. Amid a backdrop of an improving economy, massive levels of fiscal and monetary stimulus, and rising vaccination rates, we would not expect pullbacks to last very long and any potential corrections are likely to be shallow. We would be looking for opportunities to add equities on potential dips.
We reiterate our 2021 year-end S&P 500 fair-value target range of 4,400-4,450, roughly 6% above March 21, 2021, levels at the midpoint of the range. Inflation, possible interest-rate spikes, higher taxes, COVID-19 spread outside the U.S., and geopolitics are among the primary risks to our forecast.
Read previous editions of Weekly Market Commentary on lpl.com at News & Media.
IMPORTANT DISCLOSURES
This material is for general information only and is not intended to provide specific advice or recommendations for any individual. There is no assurance that the views or strategies discussed are suitable for all investors or will yield positive outcomes. Investing involves risks including possible loss of principal. Any economic forecasts set forth may not develop as predicted and are subject to change.
References to markets, asset classes, and sectors are generally regarding the corresponding market index. Indexes are unmanaged statistical composites and cannot be invested into directly. Index performance is not indicative of the performance of any investment and do not reflect fees, expenses, or sales charges. All performance referenced is historical and is no guarantee of future results.
Any company names noted herein are for educational purposes only and not an indication of trading intent or a solicitation of their products or services. LPL Financial doesn’t provide research on individual equities.
All information is believed to be from reliable sources; however, LPL Financial makes no representation as to its completeness or accuracy.
US Treasuries may be considered “safe haven” investments but do carry some degree of risk including interest rate, credit, and market risk. Bonds are subject to market and interest rate risk if sold prior to maturity. Bond values will decline as interest rates rise and bonds are subject to availability and change in price.
The Standard & Poor’s 500 Index (S&P500) is a capitalization-weighted index of 500 stocks designed to measure performance of the broad domestic economy through changes in the aggregate market value of 500 stocks representing all major industries.
The PE ratio (price-to-earnings ratio) is a measure of the price paid for a share relative to the annual net income or profit earned by the firm per share. It is a financial ratio used for valuation: a higher PE ratio means that investors are paying more for each unit of net income, so the stock is more expensive compared to one with lower PE ratio.
Earnings per share (EPS) is the portion of a company’s profit allocated to each outstanding share of common stock. EPS serves as an indicator of a company’s profitability. Earnings per share is generally considered to be the single most important variable in determining a share’s price. It is also a major component used to calculate the price-to-earnings valuation ratio.
All index data from FactSet.
Please read the full Outlook 2021: Powering Forward publication for additional description and disclosure.
This research material has been prepared by LPL Financial LLC.
Securities and advisory services offered through LPL Financial (LPL), a registered investment advisor and broker-dealer (member FINRA/SIPC). Insurance products are offered through LPL or its licensed affiliates. To the extent you are receiving investment advice from a separately registered independent investment advisor that is not an LPL affiliate, please note LPL makes no representation with respect to such entity.
| Not Insured by FDIC/NCUA or Any Other Government Agency | Not Bank/Credit Union Guaranteed | Not Bank/Credit Union Deposits or Obligations | May Lose Value |
RES-761100-0521 | For Public Use | Tracking # 1-05147072 (Exp. 05/22)