The Jekyll and Hyde Bond Market: A Tug of War Between Economic Data and Deficit Spending
Within fixed income markets, a tug of war has unfolded between two opposing forces, much like the classic tale of Dr. Jekyll and Mr. Hyde. The benevolent Dr. Jekyll emerges when economic data suggests weakness, which leads to lower interest rates and relief for borrowers. However, the menacing Mr. Hyde appears in response to America’s mounting federal debt and deficit spending concerns, which pushes rates higher via a higher Treasury term premium. And while we think the interplay between the good (lower rates) and bad (higher term premium) will persist throughout the rest of the year, given the still resilient economic conditions, we think rates, particularly the 10-year Treasury yield, could drift higher in the near term before ending the year between 4.0% to 4.5%.
A Mr. Hyde Bond Market
Deficit spending serves as the catalyst that transforms the bond market’s Dr. Jekyll into the fearsome Mr. Hyde. When the federal government spends beyond its means, it must issue new debt securities to make up the difference between revenue and outlays. Further complicating the picture for lower Treasury yields is potentially waning demand from foreign buyers as well as a yield curve that is still too flat, in our opinion.
Debt and deficit spending. With the “One Big, Beautiful Bill Act” officially signed into law, initial estimates suggest, in a best-case scenario, that deficits will continue to run in the 6–7% range of gross domestic product (GDP), suggesting Treasury issuance will need to remain elevated to fill the budget gap. The U.S. government has $36 trillion in total debt outstanding, and that number grows by $1 trillion every six months or so. To be clear, we don’t think the debt level is the problem, per se, but rather the interest expense on that debt that will continue to grow unless interest rates move meaningfully lower (which we don’t think will happen anytime soon). According to the Congressional Budget Office (CBO), net interest payments are set to make up nearly a quarter of all federal outlays by 2054, from 18% currently, while total debt loads are headed to over 160% of GDP over the same period. As interest expense as a percentage of outlays increases, it prevents the government from spending on more productive options. Moreover, since interest expenses are contractually obligated, it makes cutting spending more difficult. But ultimately, the additional supply necessary to fund deficits could weigh on prices, keeping yields elevated and net interest expenses increasing.
Foreign investors have other options again. Long-term interest rates have surged globally, with a significant sell-off in April and May pushing, among others, U.K. Gilts, Japanese Government Bond (JGBs), and German Bund yields to multi-year highs as well. As such, interest rates are higher in many non-U.S. markets, which may mean foreign investors (who make up 30% of U.S. Treasury ownership) may not be as willing to invest in U.S. Treasury securities. Non-U.S. investors, particularly from Europe and Japan, are increasingly disincentivized to own U.S. Treasuries on a currency-hedged basis due to rising home-market yields and high hedging costs.
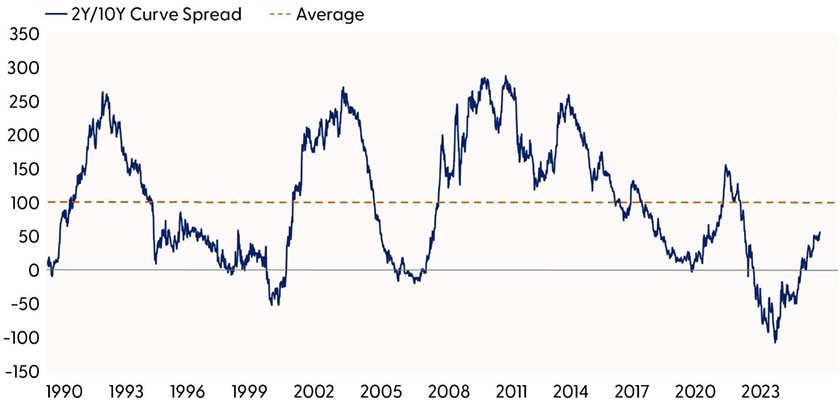
The Treasury curve still isn’t very steep. While the U.S. Treasury yield curve has recently steepened, it still isn’t steep by historical standards. Historically, the difference between the 2-year Treasury yield and the 10-year Treasury yield is close to 1%, albeit with a lot of variability. The 2Y/10Y spread is only at +0.55%, so we think the curve could further steepen throughout the year. With the 10-year only offering roughly 0.50% per year more than a 2-year Treasury but with five times the interest rate risk, it doesn’t make a lot of sense, in our view, to extend duration within portfolios.
The Treasury Yield Curve Could Further Steepen from Here

Source: LPL Research, Bloomberg, 07/16/25
Disclosures: Past performance is no guarantee of future results.
A Dr. Jekyll Bond Market (Or Why Rates Could Fall)
Yet even as Mr. Hyde prowls with fiscal concern, Dr. Jekyll stands ready to emerge whenever economic data suggests weakness. This benevolent transformation occurs because weakening conditions typically lead to lower rates through multiple channels: Federal Reserve (Fed) rate cuts, declining inflation expectations, and flight-to safety flows into government bonds despite fiscal concerns.
Ultimately, Treasury yields are the average expected fed funds rate over the life of the Treasury security, plus or minus a Treasury term premium. Moreover, the 10-year Treasury yield is highly correlated (0.98) with the expected trough in the fed funds rate, so as rate cuts get priced in and/or out, Treasury yields have moved alongside the repricing as well. Currently, markets have priced in less than two full cuts this year and an expected trough rate of around 3.5% (according to the expected secured overnight financing rate), which is higher than the Fed’s expected trough rate. As such, that mismatch provides an opportunity for price appreciation for Treasury securities if the Fed needs to cut more than what is currently priced in.
Historical and Market-Implied Fed Funds Rate
Source: LPL Research, Bloomberg, 07/16/25
Disclosures: Past performance is no guarantee of future results.
Additionally, it’s not all bad news on the budget front. In hopes of filling budget gaps, the Trump administration’s use of tariffs is expected to bring in between $2—$3 trillion over a 10-year horizon. The additional revenue would likely be enough to offset most, if not all, of the expected deficit spending in the coming years.
The Broader Perspective
Much has been written about the potential headwinds to Treasury yields, including policy uncertainty, a related increase in term premium, an ongoing lack of fiscal restraint, the de-dollarization story and fear of asset sales, the market contemplating the risk of a too dovish next Fed, better-than-feared economic data, and higher non-US yields as a few of those headwinds. But ultimately, Treasury yields are primarily a function of growth and inflation expectations, so as economic data goes, so goes Treasury yields. No doubt, obstacles remain to a sustained rally in rates, but if the economic data starts to weaken, particularly from the labor market, Treasury yields will likely fall from elevated levels. But we think the volatility in the Treasury market is here to stay unless/until the economic data softens, which should allow markets to price in more rate cuts from the Fed. Ultimately, that means the bond market’s split personality isn’t going away anytime soon — it’s the new normal in an era of fiscal excesses and economic uncertainty.
However, despite the limited price appreciation expected over the near term, we still think high-quality fixed income deserves a spot in portfolios. In our view, there is an optionality that you get from bonds that you don’t get from cash. While current yields for bonds and cash are similar, bonds provide potential risk mitigation and potential price appreciation if an unexpected event occurs that would negatively impact the economy.
That said, we don’t think now is a good time to overweight duration (interest rate sensitivity) in fixed income portfolios. A neutral duration relative to benchmarks is, in our view, still appropriate. And for those investors that want to own bonds for income, as mentioned in our 2025 Outlook, the opportunity for income remains robust with the belly of the curve (out to five years) remaining attractive.
Currency & Commodity Markets
The U.S. dollar has endured a tough 2025, with the U.S. Dollar Index (DXY) falling 10.8% in the first half, its worst start since 1973. Weakness emerged in January as post-election momentum faded and China’s DeepSeek R1 model challenged U.S. tech dominance, raising doubts about American Exceptionalism. U.S. stocks faltered amid rising recession risks, while Germany’s €500 billion fiscal package, which ended its “debt brake,” boosted the euro and European growth expectations. President Trump’s reciprocal tariffs on April 2 spurred capital outflows, with U.S. equities lagging international markets.
Technically, persistent dollar headwinds this year have dragged the U.S. Dollar Index back near a secular uptrend support line. Oversold conditions, contrarian levels of bearish sentiment and positioning, and recent positive momentum divergences all suggest a relief rally in the greenback could be in the cards for the second half. In contrast, a break below the uptrend could open the door to downside risk near 90.
The Dollar Reaches an Inflection Point

Source: LPL Financial, Bloomberg 06/17/25
Disclosures: Past performance is no guarantee of future results. All indexes are unmanaged and can’t be invested in directly.
The Dollar is Down, But Not Out
Despite its struggles, the dollar’s status as the world’s reserve currency remains secure. No alternative rivals the large, consumption-driven U.S. economy, with its stable fiscal and political systems, deep liquidity, and geopolitical strength. The dollar is also deeply entrenched in global trade, accounting for nearly half of all account-based money transfers. Furthermore, 58% of global central bank reserves are denominated in dollars, according to Bloomberg.
Dollar Dominates Central Bank Reserves and Foreign Transactions
![]()
Source: LPL Financial, Bloomberg, Society for Worldwide Interbank Financial Telecommunication 06/17/25
Disclosures: Past performance is no guarantee of future results.
Cryptocurrencies
Following the pivotal “Crypto Week” in Washington last week, the digital currency landscape saw transformative developments. On July 18, President Trump signed into law the Guiding and Establishing National Innovation for U.S. Stablecoins (GENIUS) Act, a historic first federal law regulating stablecoins. This legislation establishes a framework for banks and firms to issue stablecoins, allowing them to potentially bypass more costly traditional payment systems. Additionally, the House approved the Digital Asset Market Clarity (CLARITY) Act, which categorizes digital assets as either securities or commodities, assigning regulatory oversight to the Securities and Exchange Commission (SEC) for securities or to the Commodity Futures Trading Commission (CFTC) for commodities. This bill now awaits Senate review. Reports also suggest President Trump plans to sign an executive order permitting cryptocurrencies in retirement accounts. These advancements fueled bullish market sentiment, with Bitcoin surpassing $120,000 intraweek, and marking a major step toward the mainstream integration of digital assets and enhancing their legitimacy within the financial system.
Commodities
Commodity markets slightly outperformed equity markets in the first half. The Bloomberg Roll Select Commodity Index (a version of the Bloomberg Commodity Index that aims to mitigate the cost of rolling over futures contracts as they expire) posted a total return of 6.4%, compared to the S&P 500 Total Return Index of 6.2%.
The outlook for commodity markets in the second half of 2025 is likely to hinge on trade policy developments, which will help shape global growth and commodity performance. History suggests that investors should not expect another half of commodity market outperformance ahead. Since 1992, commodities have only outperformed stocks in both the first half and second half five times. Despite this precedent, long-term growth drivers, such as the green energy transition and data center demand, remain intact. China’s economic recovery is a critical uncertainty. Recent Chinese economic data revealed an uptick in export activity and rising oil imports, but it is hard to gain confidence in these trends being sustainable without a trade deal.
Metals
Gold continues to capture the spotlight as the precious metal rallied 26% in the first half. A weaker dollar, geopolitical tensions, elevated equity market volatility, trade uncertainty, and the return of inflows into gold-related exchange-traded funds (ETFs) helped offset higher real (inflation-adjusted) yields. Steady demand from global central banks has been another major catalyst for gold as they continue to diversify reserve holdings away from the dollar. For three consecutive years, global central banks have added over 1,000 metric tons of gold to their reserves. That’s a huge jump when you consider annual central bank gold demand averaged just 473 metric tons from 2010 to 2021. The surge in central bank demand intensified after the U.S. and its allies seized Russian central bank assets in 2022 following their invasion of Ukraine.
The trend of more gold and fewer dollars in foreign reserves could be sustainable. Over the last several years, central bankers have expressed an increased intent to add to their gold reserves, according to the World Gold Council. In 2025, 76% of central bankers indicated they would increase their gold reserves over the next five years, a notable increase from only 46% in 2022. Furthermore, 73% reported that they expect to hold a lower percentage of reserves in U.S. dollars over the next five years, up from 42% in 2022.
Central Bankers Expect More Gold and Less Dollar Reserves Over the Next Five Years
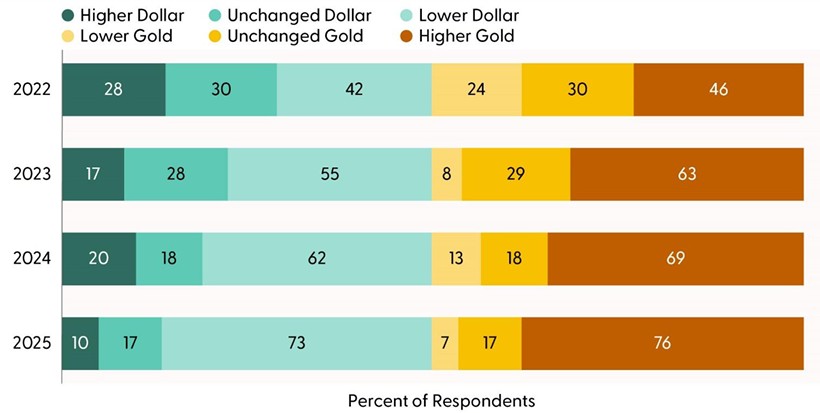
Source: LPL Research, World Gold Council 07/17/25
Copper has captured some of the spotlight in the metals space after recently surging to record highs. Buying pressure was largely underpinned by front-running demand ahead of the White House’s new 50% tariff set to be imposed on August 1 and a recent uptick in Chinese industrial production and export activity. Copper has also become an integral part of the artificial intelligence theme. The metal’s superior conductivity is vital not only to powering the surge in electricity demand from data centers but is also a key component in their buildout.
Energy
In energy, West Texas Intermediate (WTI) briefly challenged a multi-year downtrend last month but failed as oil’s geopolitical risk premium dissipated in the wake of a ceasefire agreement between Iran and Israel. The narrative in oil quickly shifted back to supply as OPEC+ announced another larger-than-expected output hike for August. The good news for oil bulls is that support around $55 held, with buyers stepping in again around $65. Technically, a close above $78.40 would reverse its current downtrend.
Asset Allocation Insights
LPL’s Strategic and Tactical Asset Allocation Committee (STAAC) maintains its tactical neutral stance on equities. LPL Research advises against increasing portfolio risk beyond benchmark targets currently, as the market seems to be factoring in a lot of positive news. Investors may be well served by bracing for occasional bouts of volatility until trade uncertainties are resolved. LPL Research continues to monitor tariff negotiations, economic data, earnings, the bond market, and various technical indicators to identify a potentially more attractive entry point to add equities on weakness.
During periods of policy uncertainty, LPL Research prefers to stray little from its benchmarks. In that spirit, the Committee recently upgraded emerging market (EM) equities to neutral, leaving regional preferences across the U.S, developed international, and EM aligned with benchmarks. The Committee still favors growth over value, large caps over small caps, and the communication services and financials sectors.
Within fixed income, the STAAC holds a neutral weight in core bonds, with a slight preference for mortgage-backed securities (MBS) over investment-grade corporates. The Committee believes the risk-reward for core bond sectors (U.S. Treasury, agency MBS, investment-grade corporates) is more attractive than plus sectors. The Committee does not believe adding duration (interest rate sensitivity) at current levels is attractive and remains neutral relative to benchmarks. The Committee would get more interested in adding long-term bonds if the U.S. 10-Year Treasury yield got closer to 5%.
Important Disclosures
This material is for general information only and is not intended to provide specific advice or recommendations for any individual. There is no assurance that the views or strategies discussed are suitable for all investors or will yield positive outcomes. Investing involves risks including possible loss of principal. Any economic forecasts set forth may not develop as predicted and are subject to change.
References to markets, asset classes, and sectors are generally regarding the corresponding market index. Indexes are unmanaged statistical composites and cannot be invested into directly. Index performance is not indicative of the performance of any investment and do not reflect fees, expenses, or sales charges. All performance referenced is historical and is no guarantee of future results.
The fast price swings in commodities will result in significant volatility in an investor’s holdings. Commodities include increased risks, such as political, economic, and currency instability, and may not be suitable for all investors.
The information presented is for educational and informational purposes only and is not intended as a recommendation or specific advice. Cryptocurrency and cryptocurrency-related products can be volatile, are highly speculative and involve significant risks including liquidity, pricing, regulatory, cybersecurity risk, and loss of principal. A cryptocurrency fund may trade at a significant premium to Net Asset Value (NAV). Cryptocurrencies are not legal tender and are not government backed. Cryptocurrencies are non-traditional investments, resulting in a different tax treatment than currency. Federal, state or foreign governments may restrict the use and exchange of cryptocurrency. The use and exchange of cryptocurrency may also be restricted or halted permanently as regulatory developments continue, and regulations are subject to change at any time. Cryptocurrency exchanges may stop operating or permanently shut down due to fraud, technical glitches, hackers, malware, or bankruptcy.
Any company names noted herein are for educational purposes only and not an indication of trading intent or a solicitation of their products or services. LPL Financial doesn’t provide research on individual equities.
All information is believed to be from reliable sources; however, LPL Financial makes no representation as to its completeness or accuracy.
All investing involves risk, including possible loss of principal.
US Treasuries may be considered “safe haven” investments but do carry some degree of risk including interest rate, credit, and market risk. Bonds are subject to market and interest rate risk if sold prior to maturity. Bond values will decline as interest rates rise and bonds are subject to availability and change in price.
The Standard & Poor’s 500 Index (S&P500) is a capitalization-weighted index of 500 stocks designed to measure performance of the broad domestic economy through changes in the aggregate market value of 500 stocks representing all major industries.
The PE ratio (price-to-earnings ratio) is a measure of the price paid for a share relative to the annual net income or profit earned by the firm per share. It is a financial ratio used for valuation: a higher PE ratio means that investors are paying more for each unit of net income, so the stock is more expensive compared to one with lower PE ratio.
Earnings per share (EPS) is the portion of a company’s profit allocated to each outstanding share of common stock. EPS serves as an indicator of a company’s profitability. Earnings per share is generally considered to be the single most important variable in determining a share’s price. It is also a major component used to calculate the price-to-earnings valuation ratio.
All index data from FactSet or Bloomberg.
This research material has been prepared by LPL Financial LLC.
Not Insured by FDIC/NCUA or Any Other Government Agency | Not Bank/Credit Union Guaranteed | Not Bank/Credit Union Deposits or Obligations | May Lose Value
For public use.
Member FINRA/SIPC.
RES-0004766-0625 Tracking #771447 | #771448 (Exp. 07/26)