India has emerged as a compelling economic growth story and an increasingly attractive alternative to China within the emerging markets complex. A growing population with a robust and young workforce, significant infrastructure spending, and an ongoing digital transformation have been key catalysts to India’s outperformance over China. India has also benefited from the de globalization trend as manufacturers move production away from China. While we may not go as far as officially calling India the new China, the economic and technical trends suggest the country may be set for a prolonged period of outperformance.
Growing Population & Robust Workforce
An impressive growth story has propelled India into a major powerhouse across the global economic landscape. Over the last two decades, the country has made impressive strides in reshaping its economy by leveraging its growing population and improving its outdated infrastructure. At the core of the growth story is the largest consumer base in the world based on its population size of nearly 1.5 billion people, according to United Nations (UN) estimates. This places India as the most populous country in the world, overtaking China for the first time since the data series started in 1950. Of course, poverty remains a key issue among the Indian population, but significant progress has been made since 2005. According to UN data, the number of people living in multidimensional poverty (based on monetary poverty, education, and basic infrastructure services) fell to 16.4% of India’s population in 2021 from 55% in 2005.
While the sheer population of India is impressive, the growth rate and age of its working population stands out, especially when compared to China. For example, over the last 20 years, India’s population has jumped 36%, widely outpacing China’s population growth of only 8% during this timeframe. Perhaps more importantly, the UN reported that more than 40% of the population is younger than 25, while the estimated median age in India is 28, marking nearly a decade younger population base than China’s. The data also shows adults aged 65 and older only comprise 7% of India’s population, compared with 14% in China. In comparison, the percentage of China’s working-age population is expected to peak over the coming years.
From an economic standpoint, India has a robust, young, and sustainable working-age population to support future growth. Real wages are also rising rapidly. According to ECA International’s Annual Salary Trends Report, real wages in India are expected to climb 4.6% this year, marking the highest salary growth rate in the Asia-Pacific region.
India Gaining Investor Attention
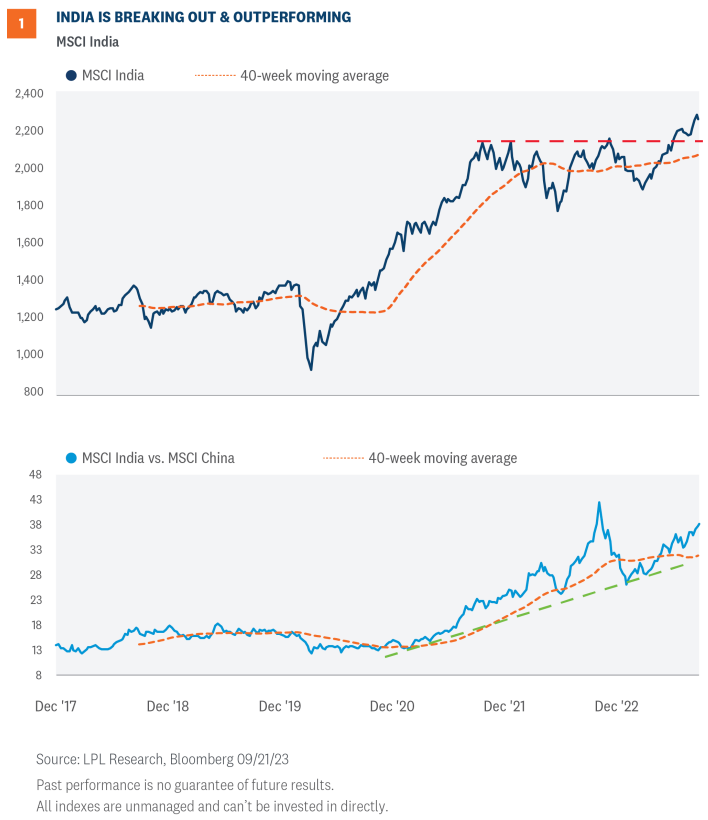
India’s growth story continues to gain investor attention. Attractive earnings, GDP growth, and the economy’s relatively successful recovery from the COVID-19 pandemic have attracted steady inflows into Indian equities. As shown in Figure 1, the MSCI India Index has recently broken out from a two-year consolidation range after rallying over 20% since March. The breakout was supported by bullish momentum and broad participation, suggesting more upside likely lies ahead. The lower panel of the chart compares the MSCI India Index to the MSCI China Index. A rising ratio chart indicates India’s outperformance over China, and vice versa for a declining ratio chart. As you will notice, India has been outperforming China since December 2020, and based on the steady string of higher highs and higher lows and the ratio chart holding above its rising 40-week moving average, we expect the trend of India’s outperformance to continue.
Inflows Return
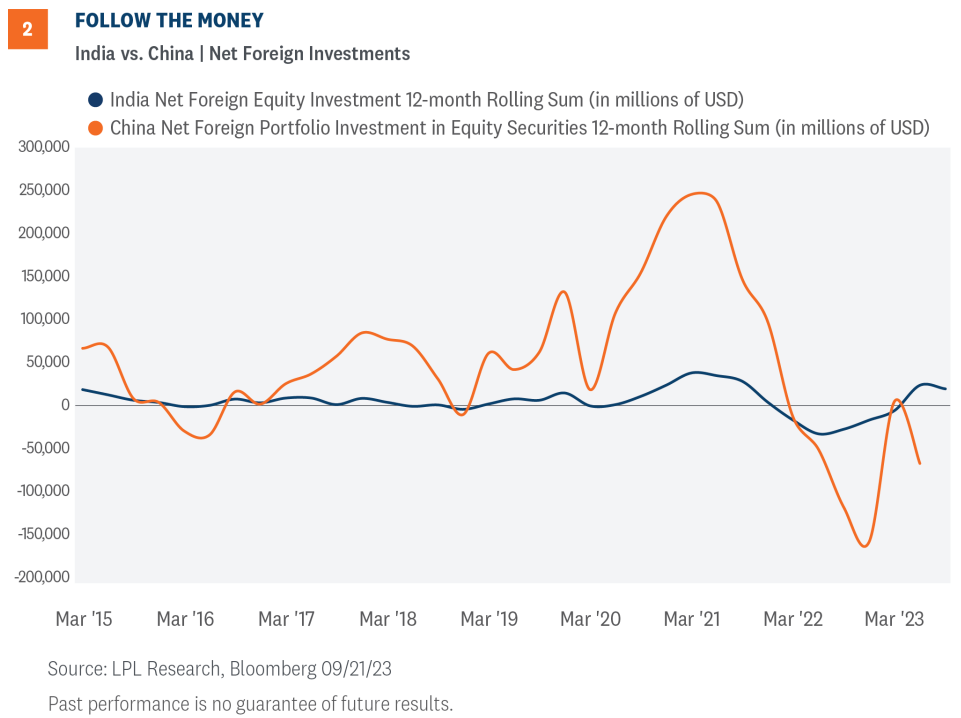
Inflows from abroad have contributed to India’s outperformance over China. As shown in Figure 2, India recorded $18.9 billion of net inflows from foreign equity funds over the last 12 months as of September 21. The pace of inflows from foreign equity investments has also been climbing steadily since March 2022. In stark contrast, years of steady inflows into China have turned mostly negative over the last year as the country deals with deteriorating economic conditions and elevated geopolitical tensions.
Growth Engines
While a growing population of nearly 1.5 billion people makes a compelling growth story, India has several other drivers of growth. The country carved out around $120 billion for infrastructure spending on improving railways and roads in its budget for this fiscal year, marking a 37% increase over the previous year and more than double the budget allocation in 2019. In total, India’s government has amassed an infrastructure pipeline from 2019 to 2025 of nearly $2 trillion. Progress is being made as the country has now doubled its national highway system to 90,000 miles over the last decade and added more electrified rail than the U.K. or France, according to an Organization for Economic Cooperation and Development report. More recently, at the G20 summit in New Delhi, global leaders, including President Joe Biden, announced a ‘memorandum of understanding’ on the India-Middle East-Europe Economic Corridor, or IMEC. The IMEC corridor, a counter to China’s Belt and Road initiative, is “expected to stimulate economic development through enhanced connectivity and economic integration between Asia, the Arabian Gulf, and Europe,” according to the White House.
In addition to infrastructure upgrades, India has undergone a digital transformation over the last several years. India has nearly 900 million internet subscribers, second to China’s 1.1 billion. India’s development of its digital public infrastructure program, which provides an identity and payment interface, has helped significantly drive its digital economy.
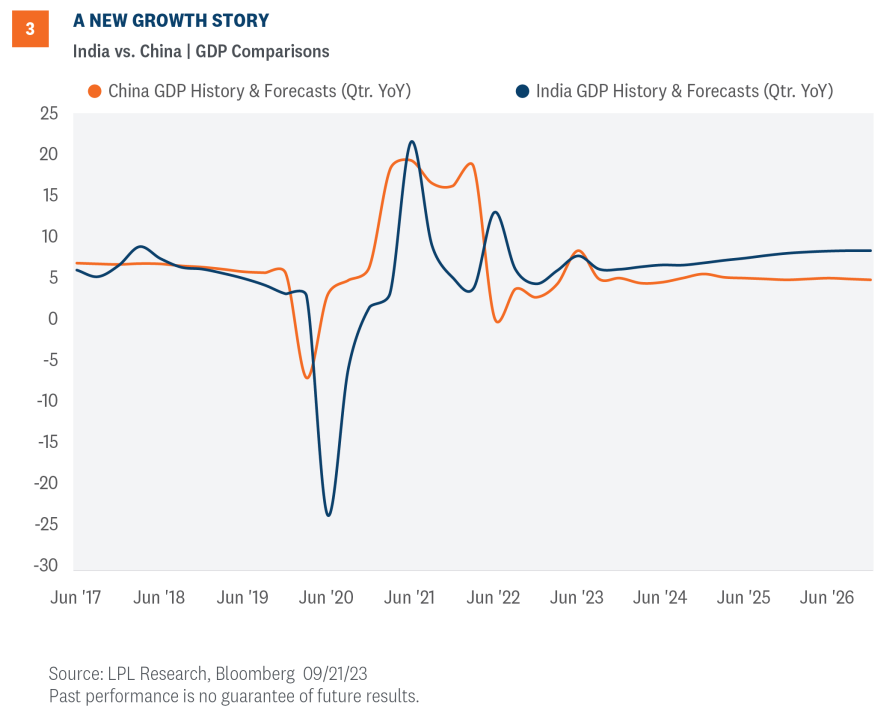
Growing domestic consumption, rising real wages, increased infrastructure spending, and the continued digital transformation in India have driven GDP growth estimates over the next few years to 7-8%. As shown in Figure 3, India has surpassed China in terms of GDP growth, a trend that is forecasted to continue over the next several years.
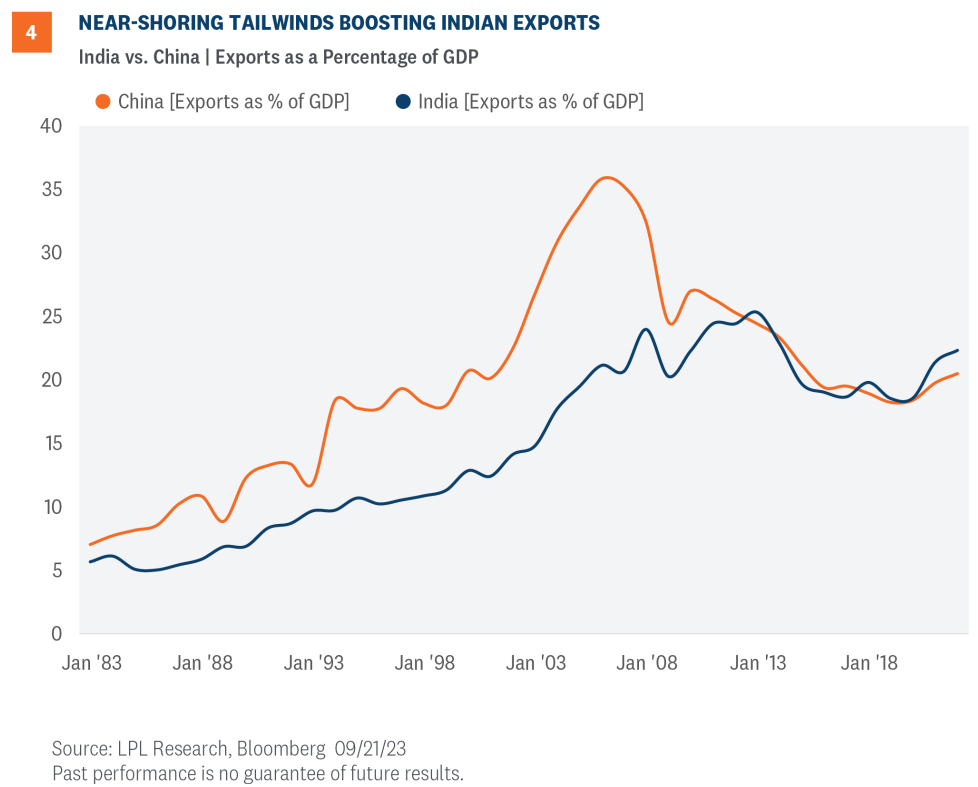
Another factor behind India’s growth has been its increased popularity as a supply source alternative to China, making it a more export-driven country that is less reliant on domestic consumption. The rise of de-globalization following the pandemic and escalating trade tensions between the U.S. and China have made India a near-shoring beneficiary. As shown in Figure 4, India’s exports as a percentage of GDP have climbed to 22.4%, now outpacing China’s exports as a percentage of GDP rate of 20.7%.
Investment Conclusion
While LPL’s Strategic and Tactical Asset Allocation Committee (STAAC) maintains an underweight recommendation for emerging markets (EM), India has become an increasingly attractive alternative to China within the EM space. The technical setup for India has turned bullish as capital from foreign investors continues to flow into the country. A growing population, rising domestic consumption due to an improving middle class, significant infrastructure spending, a digital transformation, and increasing exports have transformed India into a growth story that many investors believe could be the next China. LPL Research is also comfortable with Latin American equities within EM.
The STAAC still slightly favors developed international equities over the U.S. on the upbeat outlook in Japan, while maintaining an underweight recommendation for emerging markets (EM).
More broadly, the STAAC recommends a neutral tactical allocation to equities, with a modest overweight to fixed income funded from cash. The risk-reward trade-off between stocks and bonds looks relatively balanced to us, with core bonds providing a yield advantage over cash.
Within equities, the STAAC recommends being neutral on style, favors large caps over small, and suggests overweight allocations to the energy and industrials sectors, where appropriate.
Within fixed income, the STAAC recommends an up-in-quality approach with benchmark-level interest rate sensitivity. Core bond sectors (U.S. Treasuries, agency mortgage-backed securities (MBS), and short-maturity investment grade corporates) are currently more attractive than plus sectors (high-yield bonds and non-U.S. sectors), with the exception of preferred securities, which look attractive after having sold off due to stresses in the banking system.
IMPORTANT DISCLOSURES
This material is for general information only and is not intended to provide specific advice or recommendations for any individual. There is no assurance that the views or strategies discussed are suitable for all investors or will yield positive outcomes. Investing involves risks including possible loss of principal. Any economic forecasts set forth may not develop as predicted and are subject to change.
References to markets, asset classes, and sectors are generally regarding the corresponding market index. Indexes are unmanaged statistical composites and cannot be invested into directly. Index performance is not indicative of the performance of any investment and do not reflect fees, expenses, or sales charges. All performance referenced is historical and is no guarantee of future results.
Any company names noted herein are for educational purposes only and not an indication of trading intent or a solicitation of their products or services. LPL Financial doesn’t provide research on individual equities.
All information is believed to be from reliable sources; however, LPL Financial makes no representation as to its completeness or accuracy.
US Treasuries may be considered “safe haven” investments but do carry some degree of risk including interest rate, credit, and market risk. Bonds are subject to market and interest rate risk if sold prior to maturity. Bond values will decline as interest rates rise and bonds are subject to availability and change in price.
Preferred stock dividends are paid at the discretion of the issuing company. Preferred stocks are subject to interest rate and credit risk. As interest rates rise, the price of the preferred falls (and vice versa). They may be subject to a call feature with changing interest rates or credit ratings.
Mortgage-backed securities are subject to credit, default, prepayment, extension, market and interest rate risk.
Bonds are subject to market and interest rate risk if sold prior to maturity. Bond values will decline as interest rates rise and bonds are subject to availability and change in price.
The Standard & Poor’s 500 Index (S&P500) is a capitalization-weighted index of 500 stocks designed to measure performance of the broad domestic economy through changes in the aggregate market value of 500 stocks representing all major industries.
The PE ratio (price-to-earnings ratio) is a measure of the price paid for a share relative to the annual net income or profit earned by the firm per share. It is a financial ratio used for valuation: a higher PE ratio means that investors are paying more for each unit of net income, so the stock is more expensive compared to one with lower PE ratio.
Earnings per share (EPS) is the portion of a company’s profit allocated to each outstanding share of common stock. EPS serves as an indicator of a company’s profitability. Earnings per share is generally considered to be the single most important variable in determining a share’s price. It is also a major component used to calculate the price-to-earnings valuation ratio.
All index data from FactSet.
Value investments can perform differently from the market as a whole. They can remain undervalued by the market for long periods of time.
The prices of small cap stocks are generally more volatile than large cap stocks.
International investing involves special risks such as currency fluctuation and political instability and may not be suitable for all investors. These risks are often heightened for investments in emerging markets.
LPL Financial does not provide investment banking services and does not engage in initial public offerings or merger and acquisition activities.
This research material has been prepared by LPL Financial LLC.
Securities and advisory services offered through LPL Financial (LPL), a registered investment advisor and broker-dealer (member FINRA/SIPC). Insurance products are offered through LPL or its licensed affiliates. To the extent you are receiving investment advice from a separately registered independent investment advisor that is not an LPL affiliate, please note LPL makes no representation with respect to such entity.
Not Insured by FDIC/NCUA or Any Other Government Agency | Not Bank/Credit Union Guaranteed | Not Bank/Credit Union Deposits or Obligations | May Lose Value
RES-1627733-0823 | For Public Use | Tracking # 483021 (Exp. 09/2024)
For a list of descriptions of the indexes referenced in this publication, please visit our website at lplresearch.com/definitions.