Earnings season has kicked off with several of the big banks and a handful of other blue-chip companies having already reported results for their calendar third quarters. The key headline this reporting season will be the (likely) end of the earnings recession. The October-November reporting season can be particularly interesting because full-year numbers are nearly locked in while more companies share thoughts on the year ahead. Here are several things we will be watching as reports stream in.
Earnings Recession Looks To Be Over
FactSet consensus estimates point to flat earnings for the S&P 500 Index for third quarter 2023 compared with the year-ago quarter. With the average upside historically around 3%, our baseline expectation is for 3-4% earnings growth on a year-over-year basis, thereby ending the earnings recession that began in fourth quarter 2022 (Figure 1).
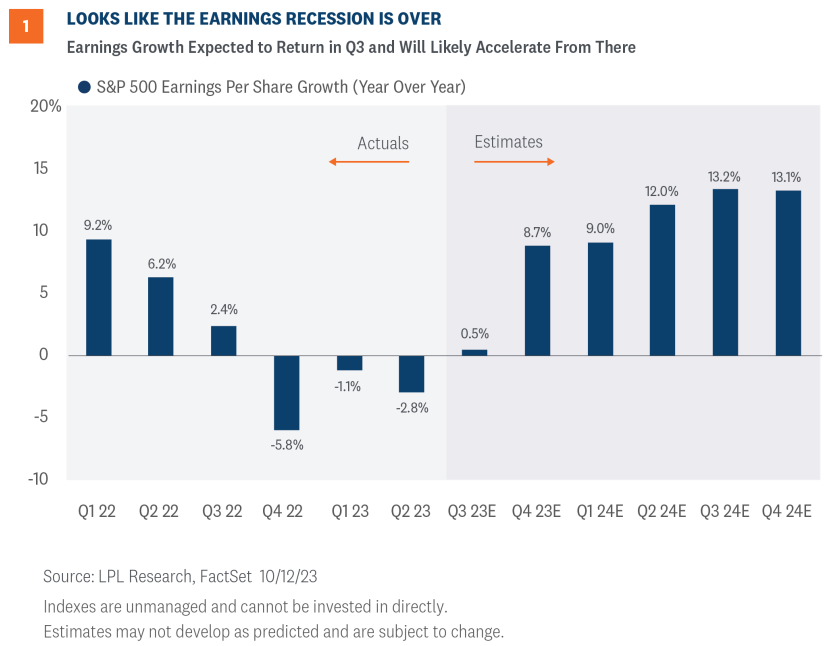
The unexpectedly strong U.S. economy in the third quarter, resilient estimate trends, and tailwinds for energy companies point to numbers pushing to the upside, while interest rate headwinds, a more challenging credit environment for banks, and waning pricing power are pulling in the opposite direction.
What To Watch
Here are several things we will be watching during the upcoming earnings season:
- Pricing power. Higher inflation translates into pricing power for companies, so as inflation has fallen, that power has been eroded some. Revenue growth for the third quarter is expected to come in at about 2%. The good news is nominal gross domestic product (GDP), which includes price increases and generally tracks S&P 500 revenue fairly well, may exceed 6% in the third quarter based on consensus forecasts. That means there is upside to revenue forecasts.
- Efficiency. Margins have been surprisingly resilient in recent quarters as inflation has come down, wage pressures have eased broadly, and companies have improved efficiency—a trend that should accelerate as artificial intelligence is more widely adopted (should be good for the technology sector in Q3). borrowing costs have not started to bite yet in a meaningful way (housing is an obvious exception). With analysts calling for S&P 500 companies to improve margins in coming quarters, the stakes are high in terms of how companies turn sales into profits. Auto and healthcare worker strikes present headwinds.
- Bank commentary on the credit environment. We have already seen credit card delinquencies and charge-offs pick up from exceptionally low and unsustainable levels. Broadly, these measures are not yet back to pre-pandemic levels, leaving more “normalization” to go as Jamie Dimon put it. Consumers have drawn down excess cash and debt service costs have risen for many, pointing to a tougher environment for consumer credit and potentially contributing to slower consumer spending in the months ahead. Meanwhile, commercial real estate remains challenged by office vacancies.
- Energy sector profitability. Oil prices rose 30% during the third quarter while natural gas prices rose about 5%, providing a strong tailwind for energy sector profits. Meanwhile, the sector’s focus on shareholder returns rather than production growth should bear a lot of fruit this earnings season. Energy companies only generated an average upside earnings surprise of 3% during the second quarter. We expect better this time around. Estimates have been rising but probably not by enough. Energy remains LPL Research’s top sector pick currently.
- Countervailing forces for industrials. Estimates for the sector have come down over the past month, so what we hear from companies in the sector will be interesting. The solid economy should shore up business confidence even though CFOs are not very optimistic about their companies’ outlooks based on the widely followed Duke University survey. Defense spending will provide a lift, though overseas wars may lead certain industry leaders to be cautious with guidance. Increased federal infrastructure spending will start to have some impact as it ramps up over the next two to three years. LPL Research maintains its overweight recommendation on the sector.
- Encore for technology? No sector has a higher bar coming into earnings season than technology after recent blowout quarters and artificial intelligence enthusiasm. The leader of the mega-cap tech parade has been NVIDIA (NVDA). Whether the chipmaker and its mega-cap peers can continue to meet rising expectations will be a tough test with the sector trading at more than a 25 price-to-earnings (P/E) multiple, well above the S&P 500’s P/E near 18.
Early Thoughts On 2024 Earnings
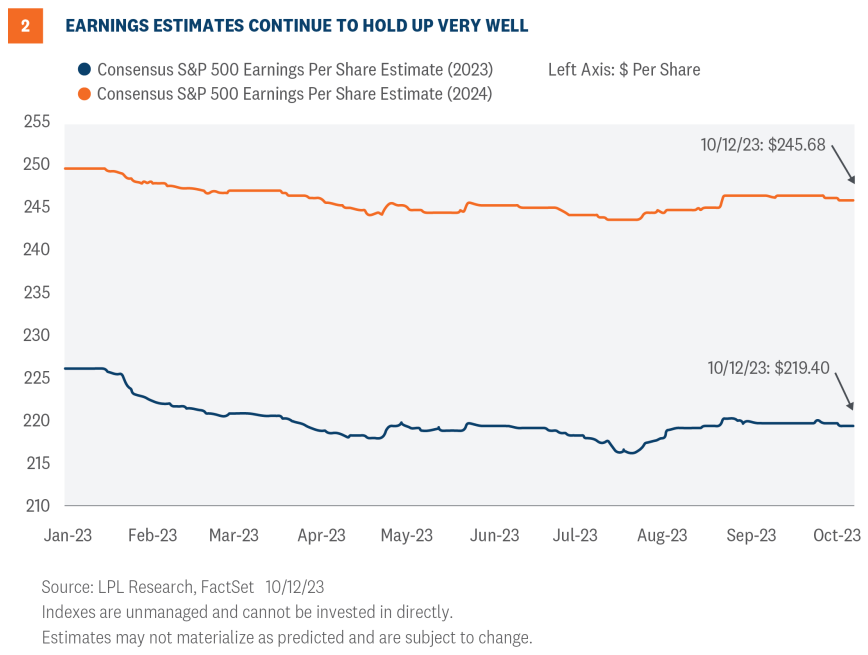
Analysts have underestimated corporate America’s ability to generate revenue and control costs throughout 2023, while economists have generally underestimated the resilience of the U.S. economy, consumers’ willingness to spend, and benefits from both prior stimulus and previously low interest rates. As a result, even under intense cost pressures, companies have exceeded expectations throughout the year and kept estimates steady (Figure 2). Remember, consensus earnings estimates for a given year have historically started off about 10% too high, on average.
A repeat performance in 2024 will be more difficult now that expectations have reset and, in our view, the economy is set to slow. However, bolstered by some strong reversals thanks to easy comparisons in the energy, healthcare, and materials sectors, an average year of earnings growth of around 8% seems reasonable at this point. Even if the economy stalls early in the year, as long as companies maintain pricing power, the job market holds up and supports consumer spending as wage growth slows, and borrowing costs remain contained as we expect, a typical year of earnings growth seems achievable.
Those are a lot of “ifs” and there are clearly downside risks, particularly as the bar has been raised. That said, we see some upside to our $230 per share forecast for S&P 500 earnings per share (EPS) in 2024, which represents only about 5% earnings growth from the current 2024 consensus S&P 500 EPS estimate ($219.40) and is 8% above our $213 estimate for this year, which is probably at least a couple of dollars too low at this point.
Happy Birthday Bull!
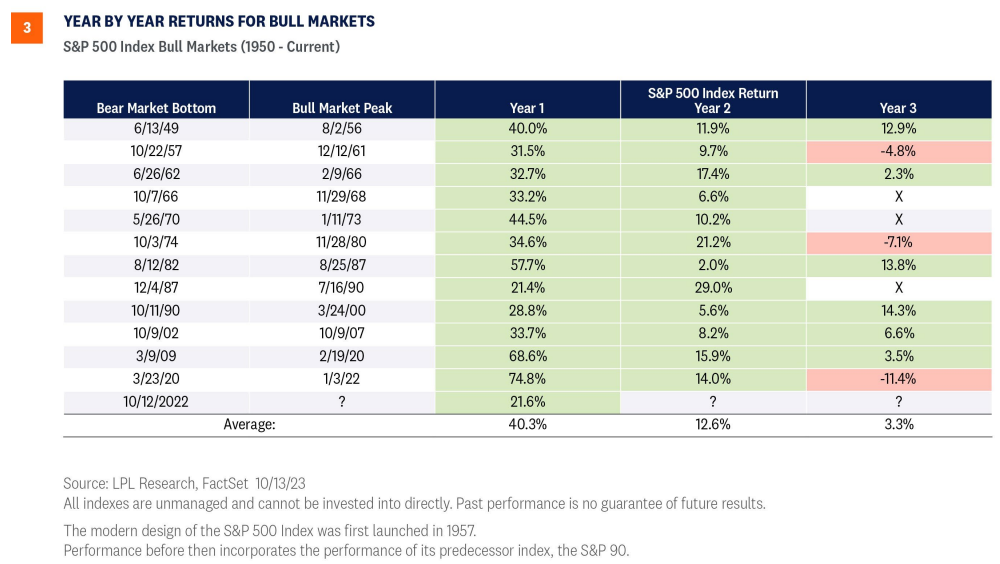
We would be remiss if we didn’t mention the current bull market turned one last week, on October 12, 2023. Year one of the current bull has been unspectacular with a gain of 21.6% (excluding dividends), compared to the historical average of around 40% (Figure 3). The tepid rebound off bear market lows has been partly due to the shallow bear market in 2022 and atypically high valuations at that time. The P/E on a next 12 months basis was over 15 at the October 2022 lows, in line with long-term averages rather than a recession-like discount, which left less upside in a rebound. Sticky inflation and sharply higher interest rates certainly also played roles in slowing this bull.
As year two of the bull gets underway, market history tells us more gains lie ahead. Of the 12 “year 2s” since 1950, the S&P 500 has gained an average of 12.6% and was positive every time, as shown in Figure 3. A gain of this magnitude seems reasonable given the likelihood of continued improvement in inflation as growth slows, which should keep the Federal Reserve (Fed) at bay in the year ahead, and the potential for interest rates to move lower, supporting stock valuations. Geopolitics have risen to the top of the list of risks for stocks, followed by re-accelerating inflation, a further rise in interest rates, and the possibility of a hard landing if the Fed has to hike rates much further.
Investment Conclusion
Third quarter earnings season should be solid given the resilience of the U.S. economy. The likely end of the earnings recession should be well received by markets, but, as always, guidance from company management teams will drive the market’s reaction.
As market participants start thinking more about earnings in 2024, we would expect stocks to garner some support. The favorable seasonal tailwinds through year end, stocks’ strong performance historically during the second year of bull markets, and our expectation that interest rates will stabilize or move lower point to upside for stocks in the coming months, though how the war in Israel plays out will be an important factor, particularly with regard to oil prices.
Latest Thinking On Asset Allocation
LPL’s Strategic and Tactical Asset Allocation Committee (STAAC) recommends a neutral tactical allocation to equities, with a modest overweight to fixed income funded from cash. The risk-reward trade-off between stocks and bonds looks relatively balanced to us, with core bonds providing a yield advantage over cash.
The STAAC recommends being neutral on style, favors large caps over small, and maintains energy and industrials as top sector picks. Our regional preference for developed international equities over emerging markets remains in place but weakening economic conditions in Europe have reduced the Committee’s conviction on international equities, leaving the asset class as a candidate for a potential downgrade.
Within fixed income, the STAAC recommends an up-in-quality approach with benchmark-level interest rate sensitivity. We think core bond sectors (U.S. Treasuries, agency mortgage-backed securities (MBS), and short-maturity investment grade corporates) are currently more attractive than plus sectors (high-yield bonds and non-U.S. sectors) with the exception of preferred securities, which look attractive after having sold off this spring due to stresses in the banking system.
IMPORTANT DISCLOSURES
This material is for general information only and is not intended to provide specific advice or recommendations for any individual. There is no assurance that the views or strategies discussed are suitable for all investors or will yield positive outcomes. Investing involves risks including possible loss of principal. Any economic forecasts set forth may not develop as predicted and are subject to change.
References to markets, asset classes, and sectors are generally regarding the corresponding market index. Indexes are unmanaged statistical composites and cannot be invested into directly. Index performance is not indicative of the performance of any investment and do not reflect fees, expenses, or sales charges. All performance referenced is historical and is no guarantee of future results.
Any company names noted herein are for educational purposes only and not an indication of trading intent or a solicitation of their products or services. LPL Financial doesn’t provide research on individual equities.
All information is believed to be from reliable sources; however, LPL Financial makes no representation as to its completeness or accuracy.
US Treasuries may be considered “safe haven” investments but do carry some degree of risk including interest rate, credit, and market risk. Bonds are subject to market and interest rate risk if sold prior to maturity. Bond values will decline as interest rates rise and bonds are subject to availability and change in price.
The Standard & Poor’s 500 Index (S&P500) is a capitalization-weighted index of 500 stocks designed to measure performance of the broad domestic economy through changes in the aggregate market value of 500 stocks representing all major industries.
The PE ratio (price-to-earnings ratio) is a measure of the price paid for a share relative to the annual net income or profit earned by the firm per share. It is a financial ratio used for valuation: a higher PE ratio means that investors are paying more for each unit of net income, so the stock is more expensive compared to one with lower PE ratio.
Earnings per share (EPS) is the portion of a company’s profit allocated to each outstanding share of common stock. EPS serves as an indicator of a company’s profitability. Earnings per share is generally considered to be the single most important variable in determining a share’s price. It is also a major component used to calculate the price-to-earnings valuation ratio.
All index data from FactSet.
Value investments can perform differently from the market as a whole. They can remain undervalued by the market for long periods of time.
The prices of small cap stocks are generally more volatile than large cap stocks.
International investing involves special risks such as currency fluctuation and political instability and may not be suitable for all investors. These risks are often heightened for investments in emerging markets.
LPL Financial does not provide investment banking services and does not engage in initial public offerings or merger and acquisition activities.
This research material has been prepared by LPL Financial LLC.
Securities and advisory services offered through LPL Financial (LPL), a registered investment advisor and broker-dealer (member FINRA/SIPC). Insurance products are offered through LPL or its licensed affiliates. To the extent you are receiving investment advice from a separately registered independent investment advisor that is not an LPL affiliate, please note LPL makes no representation with respect to such entity.
Not Insured by FDIC/NCUA or Any Other Government Agency | Not Bank/Credit Union Guaranteed | Not Bank/Credit Union Deposits or Obligations | May Lose Value
RES-1658818-0923 | For Public Use | Tracking # 491668 (Exp. 10/2024)
For a list of descriptions of the indexes referenced in this publication, please visit our website at lplresearch.com/definitions.